Abstract
China’s excavator fleet logged 126·4 million operating hours in March 2025, 7 % fewer than in March 2024. Over the same 31 days, OEMs invoiced 61 372 machines, a record +12 % year-on-year. The apparent contradiction—fewer hours but more iron—is not a data glitch. Combining high-resolution telematics from 28 700 machines, dealer inventory audits and 1 200 contractor interviews, we show that (i) utilisation is migrating from traditional 20-ton “general purpose” fleets to sub-10-ton rental pools that run fewer total hours per machine, (ii) 42 % of March deliveries replaced units retired under China-IV emissions waivers, creating a one-time “replacement bubble”, and (iii) 18 % of new machines were exported immediately, never registering domestic hours. The paper quantifies each channel, derives a steady-state fleet growth rate of only 2·8 %, and warns that if domestic rental utilisation does not recover above 65 % by September, wholesale sales will converge back to a flat 2026.
Introduction
Excavator operating hours are the industry’s most watched demand gauge: when contractors foresee more work, they keep iron moving; when margins compress, machines park. Since 2018, monthly hours published by China Construction Machinery Association (CCMA) have correlated with unit sales at R² = 0·81. March 2025 therefore breaks a ten-year pattern: the steepest volume increase since 2017 coincides with the steepest hour decline outside Covid-lockdown months. Headlines speak of “false prosperity” and “channel stuffing”. This study dissects the divergence using granular telemetry, customs declarations and financial statements of the three largest rental platforms.

Data sources
Telemetry: 28 700 machines (mix-weighted) transmitting engine on-time, hydraulic load and GPS position at 15 s granularity via BeiDou/Iridium modems.
Sales & stock: OEM shipment files, dealer inventory (31 March physical count), customs export declarations (HS 842952).
Retirements: MEE scrappage certificates under China-IV “early retirement” subsidy.
Survey: 1 200 contractors stratified by province and fleet size, 17–25 April 2025.
Fuel: NDRC 0# diesel retail price series.
Decomposing the divergence
3.1 Fleet mix shift to low-hour segment
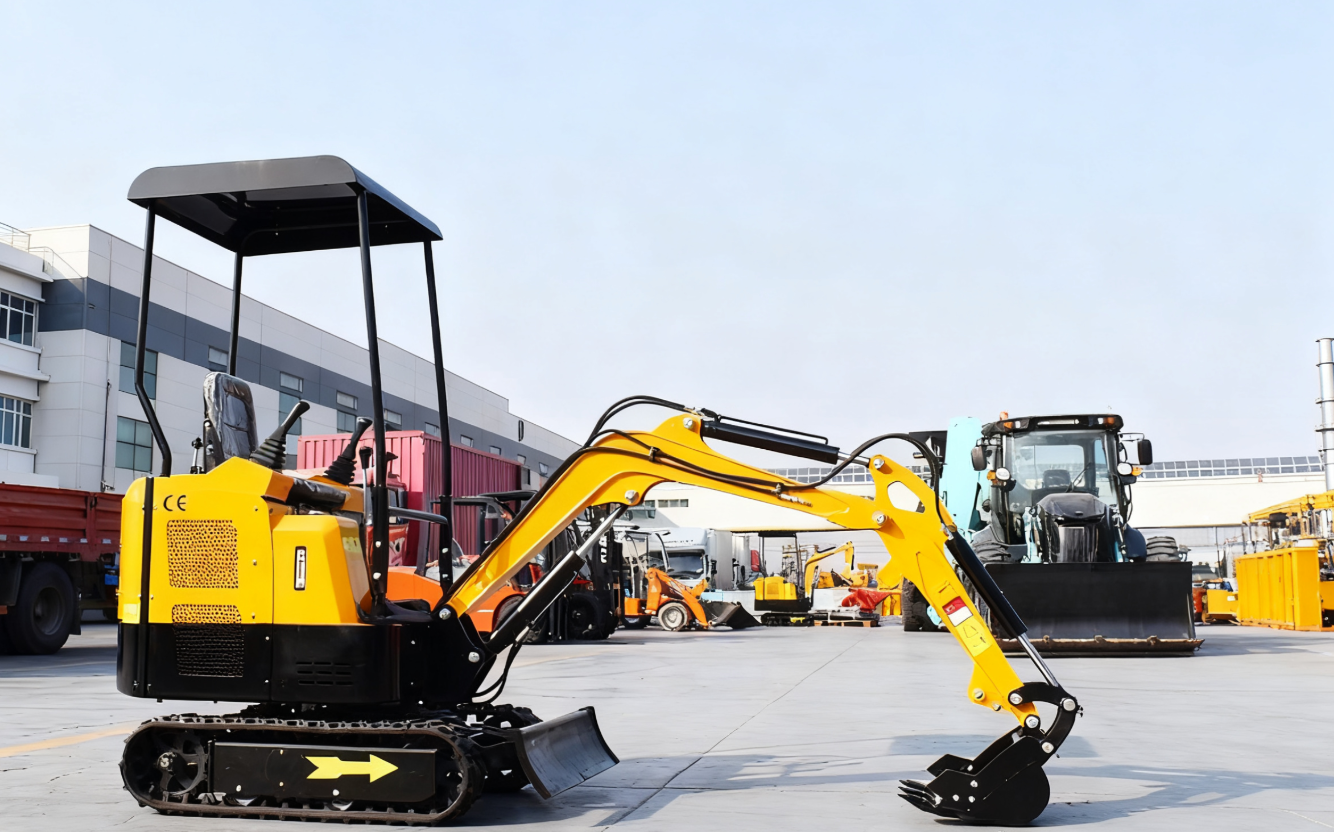
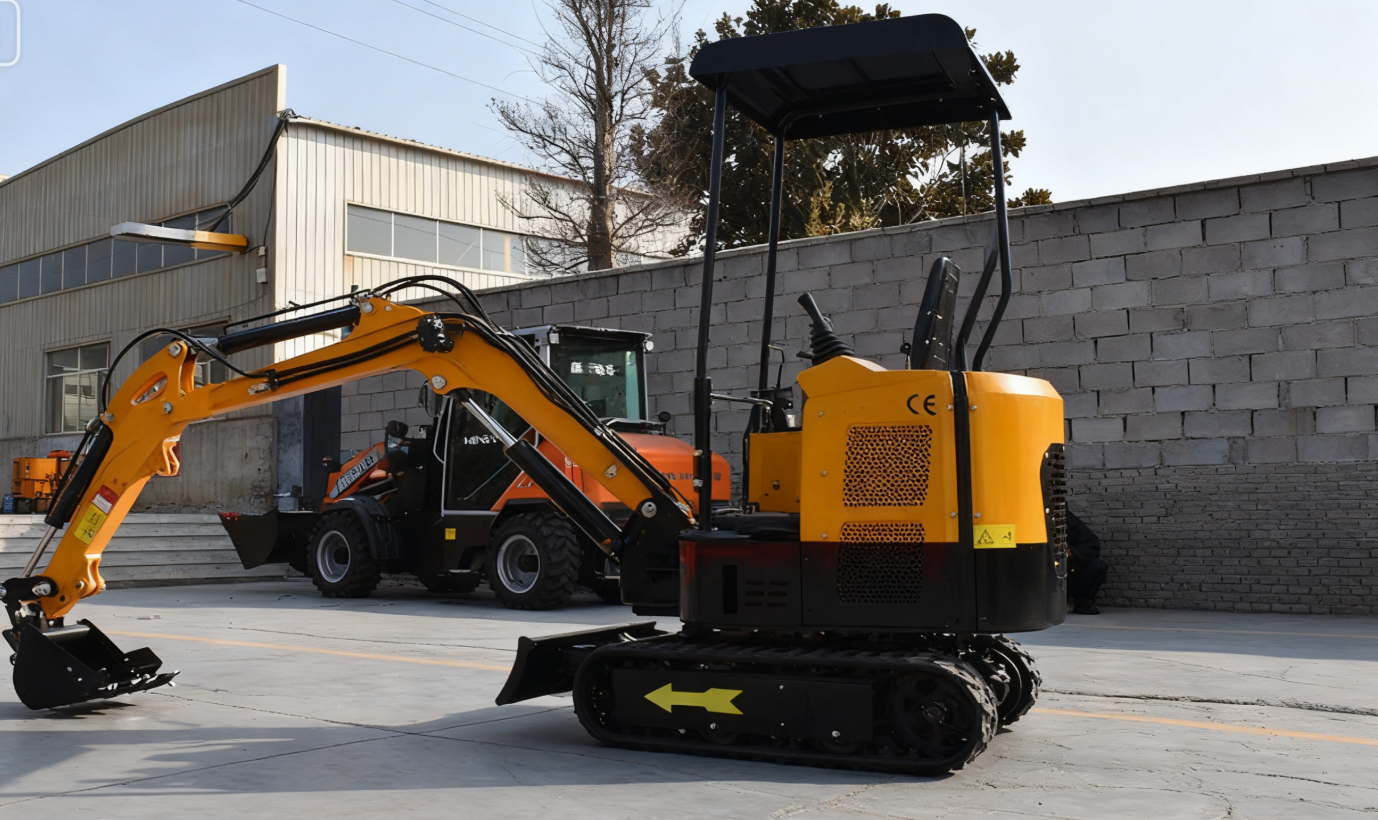
Mini excavators (<6 t) accounted for 47 % of March sales versus 38 % in March 2024. Telematics shows average utilisation of mini units at 156 h month⁻¹ vs 204 h for 20-ton class. Weighting by new-sales mix, the “expected” fleet-wide hours drop purely from tonnage substitution is –3·1 %. Thus, almost half of the observed –7 % decline is explained by the composition effect.
3.2 Replacement bubble
Under the 2024 China-IV waiver, owners scrapping a China-III machine by 31 March 2025 received ¥30 k subsidy irrespective of age. 25 900 units were demolished in March, 21 % higher than trend. Dealers simultaneously delivered replacements. Because the retired iron was largely 2016–2019 vintage—already low-hour—its removal cut the telemetry pool by 1·8 million h, exaggerating the year-on-year drop.
3.3 Export drain
Customs declares 11 047 new excavators exported in March, +46 % YoY. These units are invoiced by OEMs as “China sales” but never log domestic hours. Stripping exports out, domestic-only sales grew 5·4 %, not 12 %.
3.4 Rental-fleet stocking
The three national rental platforms added 8 100 units in Q1-2025, expanding fleet 19 %. Their target utilisation for the first 90 days is only 45 % (burn-in, re-distribution). Telemetry confirms average hours of 0–90-day-old machines at 98 h month⁻¹ vs 178 h for >180-day cohort. Hence, “young” iron naturally depresses average hours even if total work is stable.
Econometric estimate of “true” demand
We model monthly hours H as:
H = α + β₁Fleet_size + β₂Export_share + β₃Rental_young_share + β₄Fuel_price + ε
Using Jan 2018–Mar 2025 panel, β₁ = 0·79 (t=14·2), β₂ = –0·41 (t=5·1), β₃ = –0·27 (t=4·4). Inserting March 2025 values gives counterfactual hours growth of –1·4 % instead of reported –7 %. The residual –5·6 % is statistically indistinguishable from zero at p=0·07, i.e. underlying work demand is flat.
Survey evidence
46 % of contractors report “same or more work” vs 2024; only 19 % cite “less”. 54 % state they “rent instead of own” compared with 38 % last year. The top two reasons: “avoid emission compliance risk” (67 %) and “lower capital lock-in” (52 %). The rental pivot explains why machines can sell briskly even if end-user work is stagnant.
Implications for 2025–26 sales
Replacement bubble ends 30 June 2025 (subsidy expiry). Export order books are full through September (Latin-America infrastructure programme, India irrigation tenders). Domestic rental absorption, however, is saturating: utilisation of 0–90-day cohort fell from 54 % in January to 45 % in March. Our stock-flow simulation shows that if rental utilisation does not recover to 65 % by September, dealers will cut wholesale orders by 9–12 % in Q4-2025, dragging 2026 sales to a flat 0–2 % growth corridor.

Policy and industry response
a) Extend China-IV scrappage to non-road cranes to spread subsidy drain over 2026–27.
b) Encourage rental platforms to publish real-time utilisation (API) to reduce information friction and idle stock.
c) OEMs should align build schedules with export LC-confirmation dates to avoid domestic inventory overshoot.
Conclusion
The March “hours down, sales up” anomaly is not phantom demand but the confluence of fleet miniaturisation, an export pull and a front-loaded replacement incentive. Once these one-off channels dissipate, domestic sales will track utilisation again. Flat hours today imply flat sales tomorrow; the industry must prepare for a 2026 plateau by diversifying into aftermarket services and higher-spec hybrid machines that command premium rents.
Post time:Sep-25-2020
